Geoscience Women in STEM
Lesson 2: The Stories Trees Can Tell
By her own account, Dr. Jahren's most exciting work as a scientist often begins and ends with the common tree. This lesson encourages students to delve into this scientific world, discovering for themselves some what we can learn from tree rings, atmospheric conditions, and climate data from around the globe.
Students can investigate the science that Dr. Jahren discusses in her videos. In the first activity here, students explore Dr. Jahren's love of trees as they work with a tree ring simulation, analyze tree-ring data, and create a model to demonstrate what they've learned about paleoclimates. In the next activity, students analyze climate data from sites around the world to understand how climates are defined. Then students connect climates and biomes using satellite imagery. Students examine NASA data and read an article about current changing rates of photosynthesis. Finally, students design and conduct an experiment where they investigate various plant stressors.
Connections to Next Generation Science Standards (NGSS)
To learn more about Science and Engineering Practices click here
- Science and Engineering Practice: Analyzing and Interpreting Data, Developing and Using Models
- Crosscutting Concepts: Systems and System Models, Patterns
Activities to Consider Using With Students:
Dr. Jahren's work aligns with many disciplinary core ideas in your curriculum. Consider how the following activities can engage your students in thinking deeply about the types of investigations scientists like Dr. Jahren conduct.
Activity: The Secrets of Trees
To introduce students to the science of trees and tree cores, watch Video 9: "Why do you love trees?"
Watching the video, students can begin to think about the secrets we can unravel by studying trees.
To access the student-ready version of the activity "How do we know about paleoclimates? Evidence from trees" click here
In the investigation "How do we know about paleoclimates? Evidence from trees," students use a tree-ring simulator to determine patterns of weather conditions recorded during the lifetime of a tree.
Students consider the impacts of temperature and precipitation on tree growth over time. Students then collect data from a set of tree cores dating back to 1402 that has been simulated from 387 trees in northern hemisphere locations. The data they collect is then used to draw conclusions and suggest a model for the impact of climate changes over time as evidenced by tree growth.
Activity: Graphs that Describe Climate
For the "Graphs that Describe Climate" activity click here
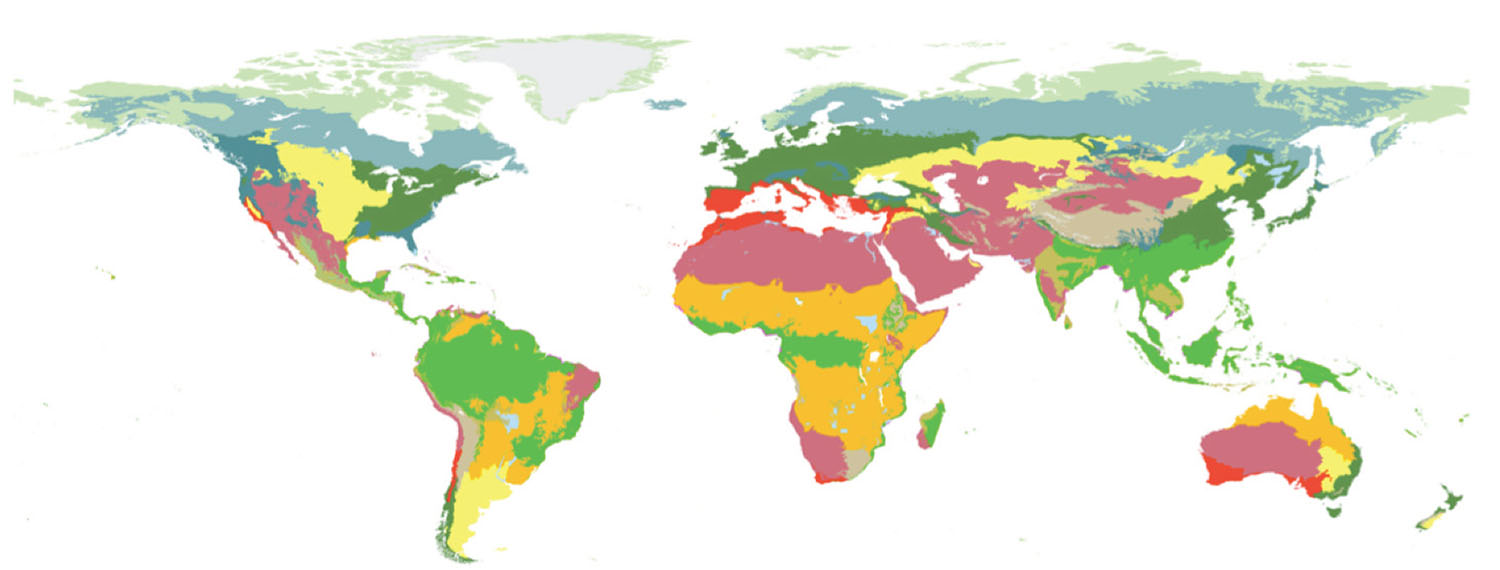
As a way of reviewing the various environments on Earth, have students view Video 10: "What are some of the most interesting places on Earth for a plant lover?" After viewing the video, students are likely to have questions about what the climate is like in various regions of the Earth. They can investigate these questions in the activity "Graphs That Describe Climate" from EarthLabs.
In the activity, students can select climatographs from various locations and compare them to each other, and/or develop their own climatograph for their location using data from the NOAA Earth System Research Laboratory page: U.S. Station Climatologies.
Activity: GLOBE Earth System Poster Activity Guide
For the "GLOBE® Earth System Poster Activity Guide" click here
The "GLOBE® Earth System Poster Activity Guide" provides students with several investigations to better understand the interconnectedness of Earth's systems. By examining the variables addressed in guide's activities, students can begin to grasp the interplay among systems at various time scales.
Activity: Earth, CO2, and Plants
With your students, watch Video 11: "What happens to the Earth's plants if atmospheric carbon dioxide levels go off the charts?" The video can help students think about the impacts of human activity on plants.
NASA's "Global Climate Change: Vital Signs of the Planet — Carbon Dioxide" website.
For the article "CO2 is Making Earth Greener — for Now" click here:
Ask students: What would happen to plants in our area if CO2 levels were to increase dramatically? Encourage students to make a hypothesis. Then have students do a close read of the NASA article, "CO2 Is Making Earth Greener — for Now." Ask students to study the time series graphs of atmospheric CO2 concentrations on the NASA "Global Climate Change: Vital Signs of the Planet — Carbon Dioxide" website.
In small groups, students should debrief the evidence from the article and atmospheric CO2 concentration graphs to draw conclusions related to their hypotheses.
Activity: Designing an Investigation
For an example of how investigations might be constructed by advanced students click here
Dr. Jahren talks about the research that she is most excited about advancing in her laboratory in Video 12: "What research are you doing that you're most excited about now?"
After viewing the video together, guide students in designing an investigation to test environmental factors' impact on plants. Provide students with guidelines such as:
- A given list of variables: light, water, soil, temperature, wind, etc.
- A list of materials: various light sources, cabinets (darkness), water (various amounts, temperature), substances that can alter soil/water chemistry (e.g., vinegar, salt, baking soda, window cleaning fluid), various types of soils, sources of heat/cold, fans, etc.
Students should be encouraged to design investigations of the effects of selected variables on plants.
Activity: Wrapping Up Lesson 2
After completing the activities in Lessons 1 and 2, students likely want to discuss how their perceptions of scientists, and the work they do, have evolved. Ask your students to do a think-pair-share or small group discussion around the prompt:
How does increasing the diversity of STEM practitioners change the questions we ask and investigate in STEM?