Earth Science Week Classroom Activities
Processes Below The Water
Activity Source:
Organizing partners of Geologic Map Day are the U.S. Geological Survey, the Association of American State Geologists, the National Park Service, the Geological Society of America, NASA, and the American Geosciences Institute.
Geologic maps and Google Earth™ images provide images that are snapshots of the times they were made. Weathering, erosion, and deposition continue to break down and build up Earth’s surface. In this activity you will explore the channel of the Colorado River that is submerged by Lake Powell and look for evidence of change.
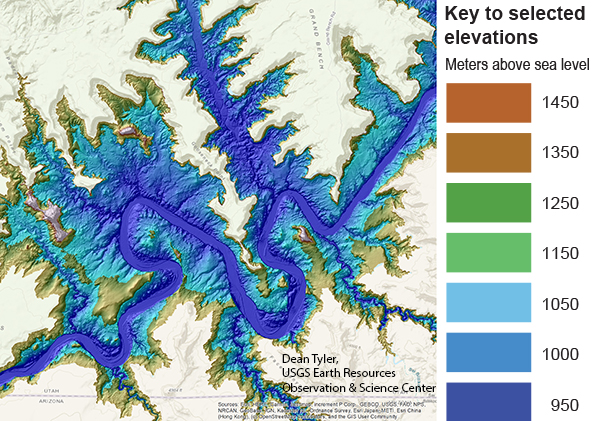
Dean Tyler, USGS Earth Resources Observation & Science Center.
- Go to the Coastal National Elevation Database (CoNED) (https://www.usgs.gov/core-science-systems/eros/coastal-changes-and-impacts) and open the “CoNED Project Viewer” to view the topobathymetric maps there. These maps show the topography (land elevation) and bathymetry (water depth) of the areas. Zoom into Lake Powell. Use the online “Legend” or the color “Key to selected elevations” to identify the former channel of the Colorado River. What color is used to indicate the river channel?
- Go to the “3D Topobathymetric Digital Elevation Model for Lake Powell Storage Capacity Assessment” on the CoNED website (https://bit.ly/21xGMD5). In the “Overview” tab, scroll down to the video of the three-dimensional (3D) view of Lake Powell (in the above image).
- Watch the video once all the way through. At the beginning of the video, notice where the road crosses the lake. That is where the dam is located.
- Restart the video and look at the landform on the channel floor immediately upstream (behind) of the dam (in the below image). How could it have formed?
- Continue watching the video and identify features of erosion and deposition in the former channel. These submerged deposits are not shown on the geologic map.
- If the erosion and deposition features in the channel were to be shown, what rock unit label would you give them? Write a short description that you could use for these rock units.
- Research how deposition can cause problems for dams. In what ways can geologic maps be tools for solving the problems caused by deposition?
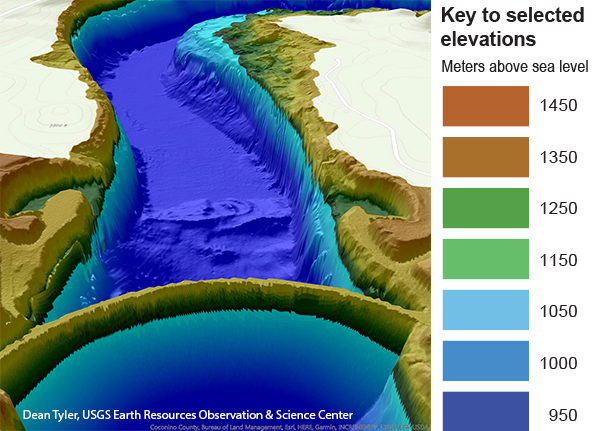
Dean Tyler, USGS Earth Resources Observation & Science Center.
We hope you enjoyed using this unique geologic map and related tools. This is just one of thousands of maps in the USGS National Geologic Map Database. The catalogue can be searched by location and themes, including geology, geophysics, marine, resources, hazards, and more. Find your local geologic map and explore the Earth system beneath your feet! Visit https://ngmdb.usgs.gov/mapview/?center=-97,39.6&zoom=4 or https://ngmdb.usgs.gov/ngm-bin/ngm_compsearch.pl
Download a printer-friendly PDF of the 2021 Geologic Map Day activities, map and key here
NGSS Connections for Activities
Disciplinary Core Ideas
• Earth’s systems: 1, 2, 3, 4
• Earth and human activity: 1, 2, 3, 4
Crosscutting Concepts
• Patterns: 1, 2, 3, 4
• Structure and function: 1
• Scale, proportion, quantity: 2
• Cause and effect: 3
• Stability and change: 4
Science and Engineering Practices
• Planning and carrying out investigations: 1
• Analyzing and interpreting data: 1
• Developing and using models: 2, 3, 4
• Obtaining, evaluating, and communicating information: 2
• Engaging in argument from evidence: 3
• Asking questions and defining problems: 4