Earth Science Week Classroom Activities
What Covers Our Land?
Activity Source:
NASA, Adapted with permission.
Looking at Earth from space is inspiring. All of the colors you see in a satellite image tell you a lot about the world around us. What is on the land around you? Pavement? A grassy lawn? A forest? What covers our land matters because we depend on and pasture to produce food, forests for wood products, plants for clean air, and water to support wildlife.
Mapping land cover is important for people studying how plant cover, water bodies, and other resources are changing with shifting temperature and rainfall patterns. It helps scientists and land managers understand fire and flood risks too. We can make land cover maps by going outside and charting what we see, but we also can use satellite data for the “big picture” scale.
Different kinds of land cover have different colors in satellite images. A ground-based map is a very detailed map of a small area. A satellite map shows a large area, but in less detail. Both mapping techniques are needed to get a complete view of Earth’s changing land cover. You can make a land cover map using both techniques in this activity.
Materials
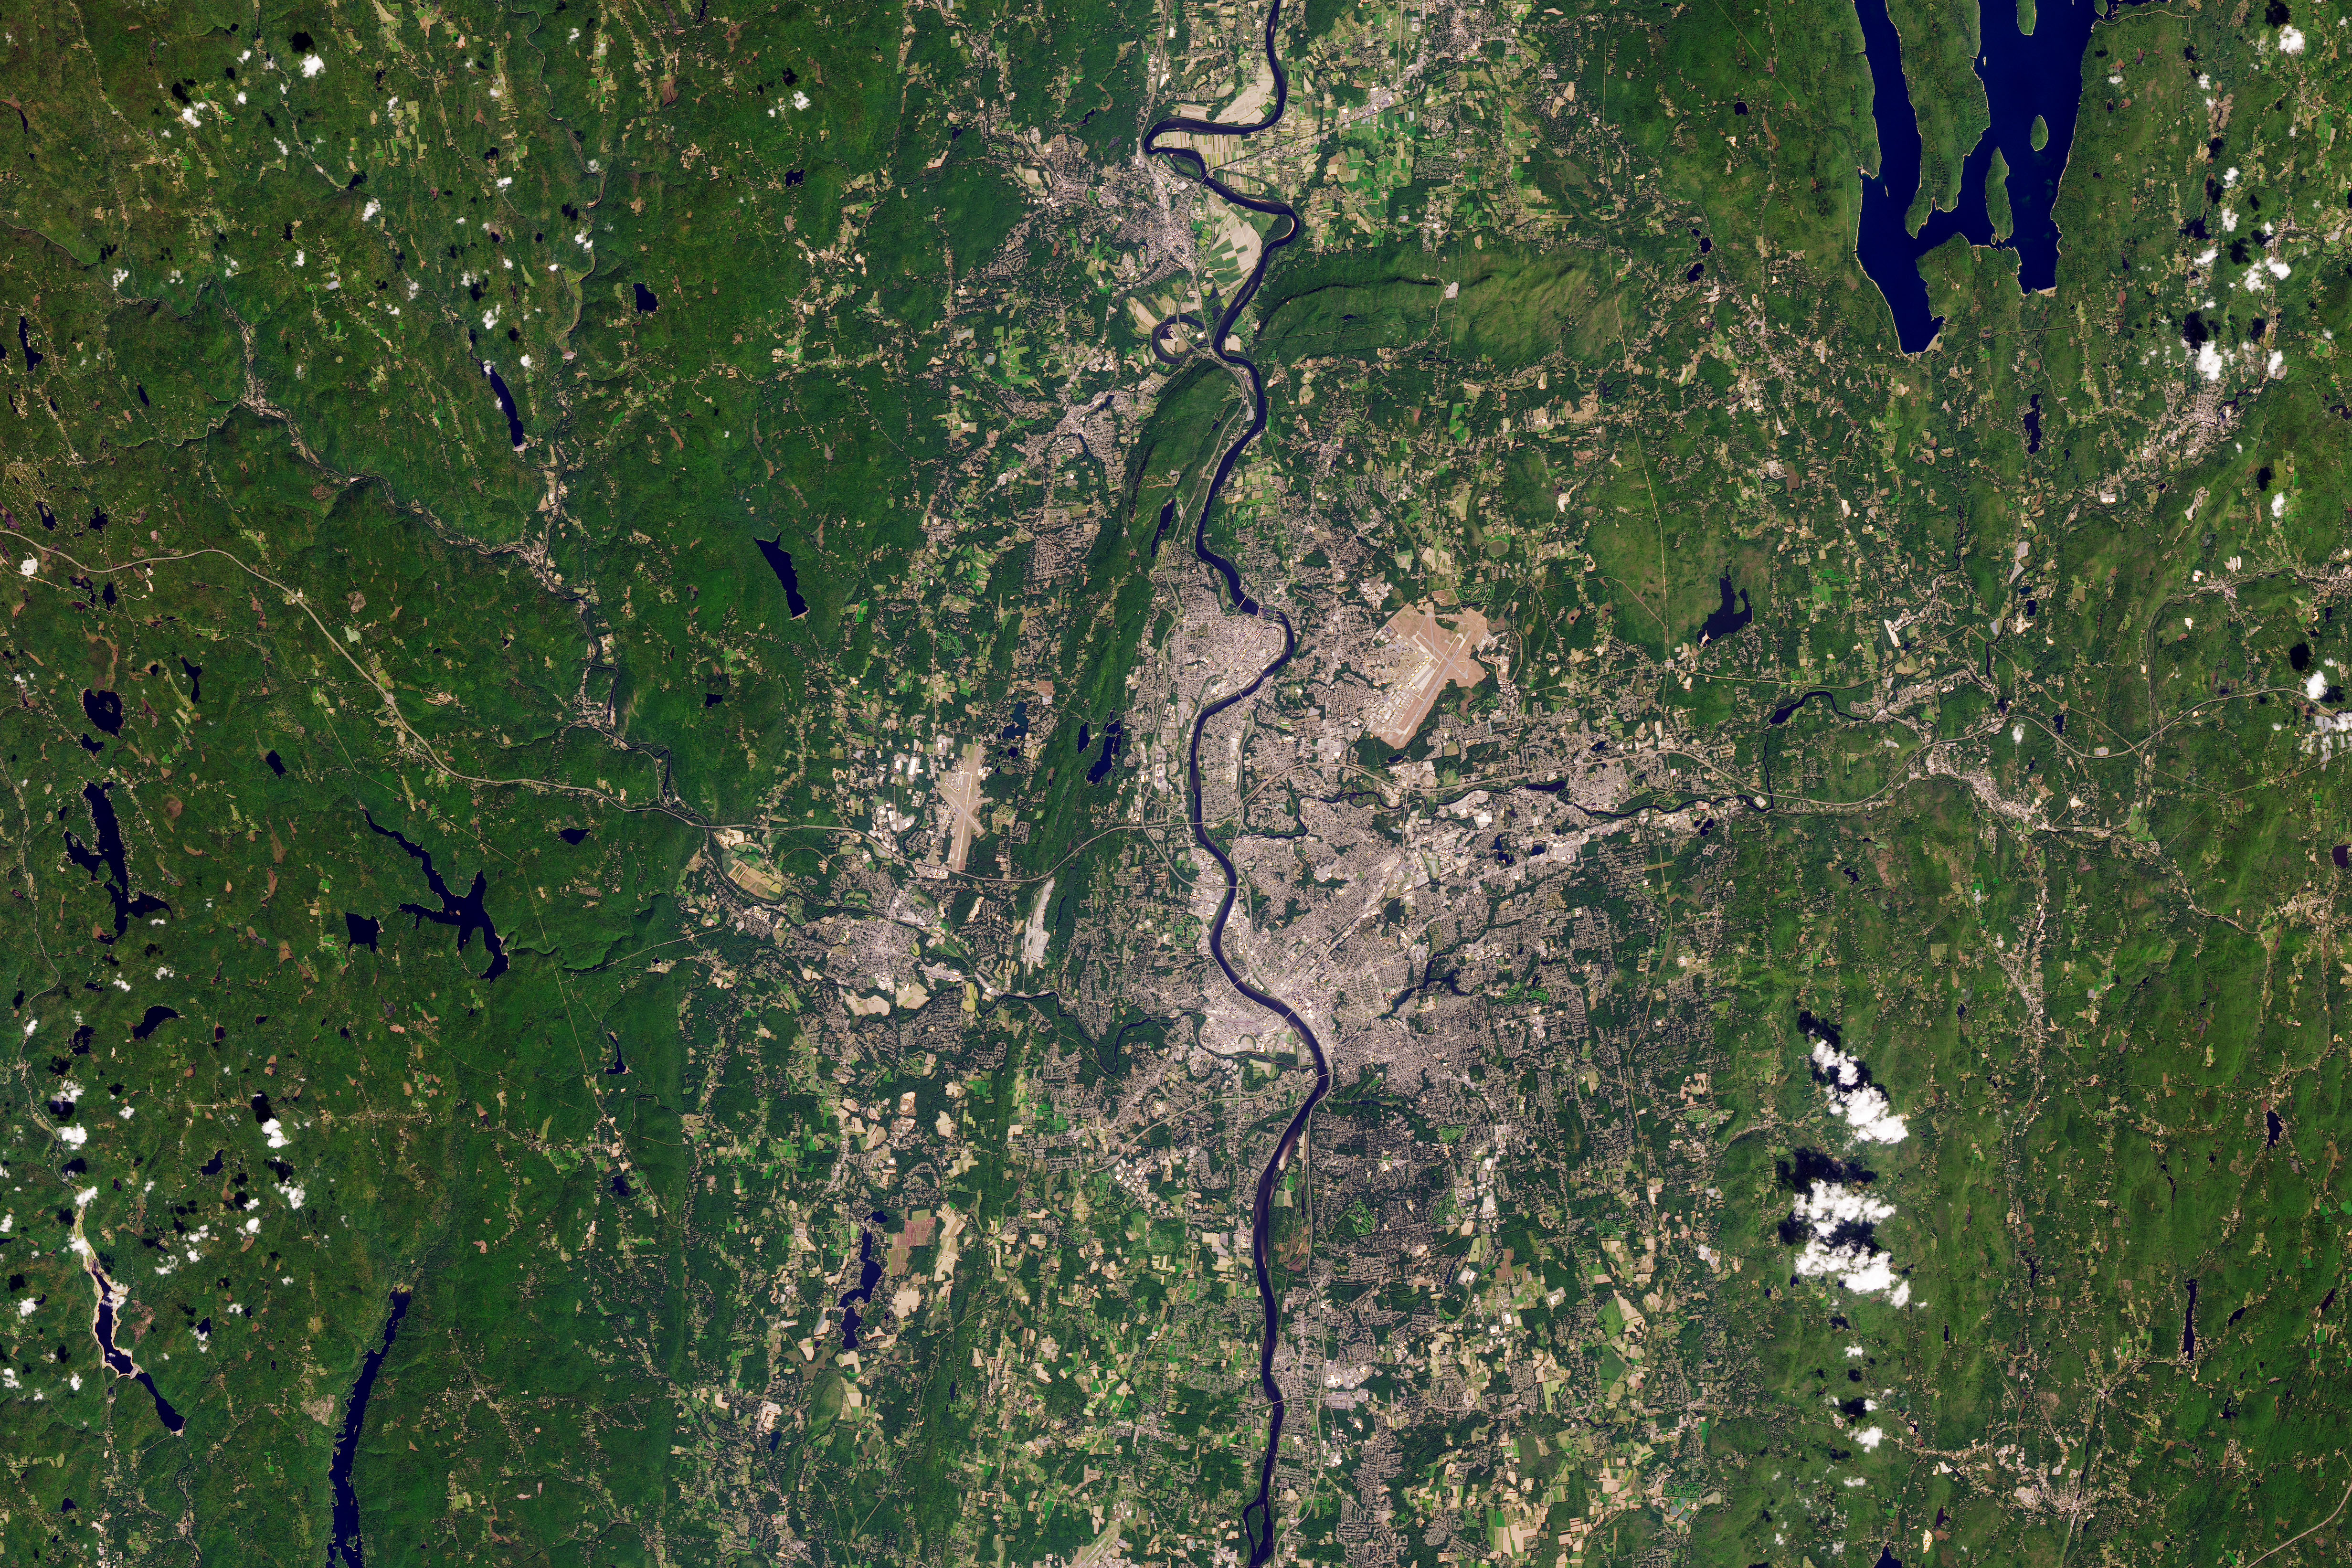
- Color print out or digital display of this Landsat satellite image of the Connecticut River
- Grid printed on transparency sheets or see-through paper
- Dry erase or transparency markers or colored pencils
Procedure
1. Perhaps beforehand to save time, print a color copy of the satellite image. Also, print or make a grid on a transparency or thin see-through paper. A printable grid can be found on page 19 of this document.
2. Look at the satellite image of the Connecticut River. Does the land look the way you think you might see it from space? Why?
3. Discuss what you see in the satellite image. The image includes city, forest, farms, and bodies of water. What color are cities? Forest? Farmland? Water?
4. Working in small groups or individually, place the transparent grid over the image, then color all of the grids according to the which feature is covers most of that square:
| Feature | Color | Number of Cells | Percent of Land cover |
|---|---|---|---|
| Forest | Green | ||
| Farmland | Orange | ||
| Cities | Black | ||
| Water | Blue | ||
| Other: ____ | ____ |
If more than one land cover type is in a square of the grid, choose the type that covers the most area.
5. Your colored grid is a land cover map. Count all of the forest squares. What percentage of the total land is forest? Calculate this by counting the total number of squares in the grid. Divide the number of forest squares by the total and multiply by 100.
6. What percent of the land is farmed? What percent is city? Water?
7. What would a land cover map of your schoolyard look like? Assign each student a square area of the schoolyard to map. Choose land cover types appropriate for your area like grass, pavement, or trees. Combine all of the squares into a land cover map.
Extensions
- Download the free GLOBE Observer app and click on land cover to map land cover beyond the school ground (this data helps scientists studying land cover).
- Interpret more satellite images to better understand land cover. A collection of images can be found at NASA Earth Observatory or NASA Goddard image databases.
- How is land cover changing? Compare two satellite images and calculate how land cover is changing. Instructions can be found in Quantifying Changes in the Land Over Time.
NGSS 3-D Learning
- Science and Engineering Practices – Analyzing and Interpreting Data
- Disciplinary Core Ideas – Earth Systems: water and land use changes (ESS2.C), land cover changes (ESS3.C)
- Crosscutting Concepts – Scale, Proportion, and Quantity