Earth Science Week Classroom Activities
GIS and Careers

Activity Source:
ESRI. Adapted with permission.
Geographic information systems (GIS) are mapping and analysis tools that people use in all walks of life. GIS is problem-solving technology, for careers in research, policy-making, and production — in government agencies, non-profit groups, and for-profit companies, from global to local levels.
Whatever the sphere — atmosphere, hydrosphere, cryosphere, lithosphere, or biosphere — there are little challenges and major dilemmas that can be addressed only by examining the patterns of where things are, the traits of things here versus things over there, and how things relate to each other.
People who can gather, explore, and integrate data, analyze relationships, and make plain the hidden patterns will help identify resources, preserve habitat, provide energy, reduce impact, monitor change, catalog variety, explain complexity, and develop strategies for improving life that will affect everyone, 24-7.
So, whether you like caves or clouds, oceans or mountains, oxbows or rainbows, watersheds or viewsheds, stalactites or satellites, floodplains or cities, sound waves or seismic waves, floating or flying, cumulus clouds or computer clouds, collecting or calculating, jumping in or plugging in, generating or consuming, and physical world or virtual world, your future includes GIS.
GIS is technology for solving problems, and employers everywhere seek workers who know how to make good decisions in a complex world.
Materials
- Computer with an Internet access
Procedure
See your future by exploring careers with Esri.
Examples
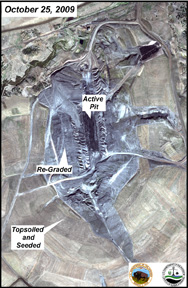
USA DOI
Balancing resource needs and environmental concerns requires deep
understanding of many issues.
Image courtesy of USDOI.
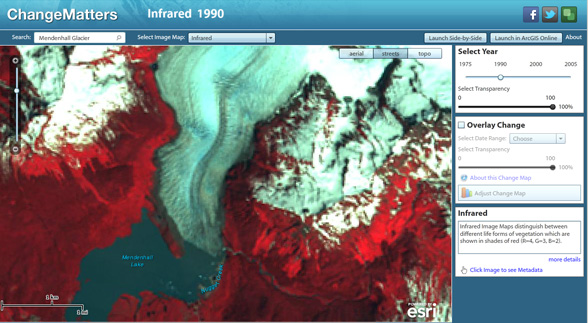
ESRI
The Mendenhall Glacier in southeast Alaska has receded significantly from its
position shown in this 1990 infrared image.
Data from Landsat. Map courtesy of ESRI.
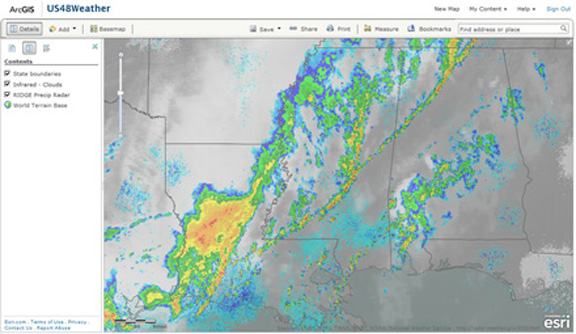
ESRI
The constant change and extremes of weather require constant adaptation.
Data courtesy of NOAA. Map courtesy of ESRI.
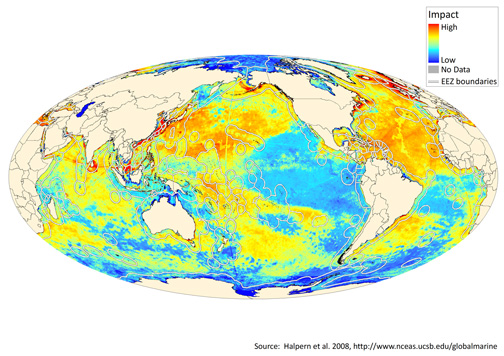
Conservation International
Many important marine areas face threats from various sources.
Data from NCEAS. Map courtesy of Conservation International.
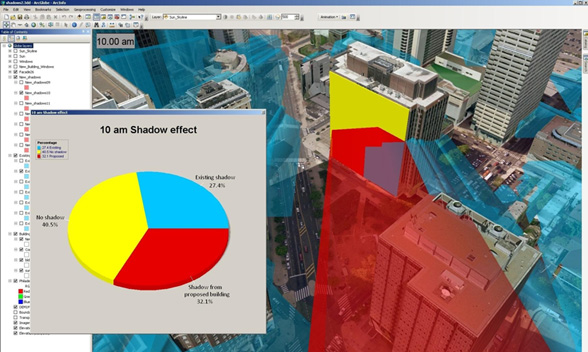
ESRI
Modeling year-long variations in shadows from a proposed building helps
planners assess impact.
Image courtesy of Pictometry. Map courtesy of ESRI.
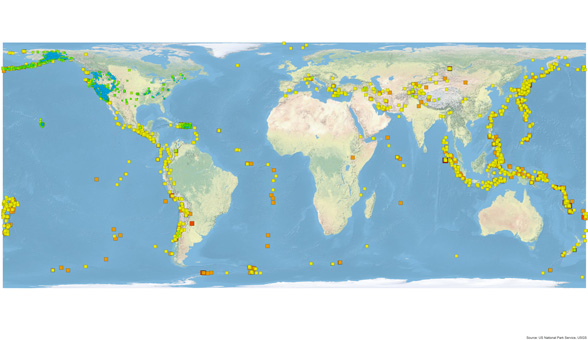
ESRI
Earthquakes from a recent three-month period, classified by magnitude.
Data courtesy of USGS. Map courtesy of ESRI.