Earth Science Week Classroom Activities
Logs of Straw - Dendrocronology

Activity Source:
“Logs of Straw: Dendrochronology,” U.S. Geological Survey, 2002. Adapted with permission.
Background
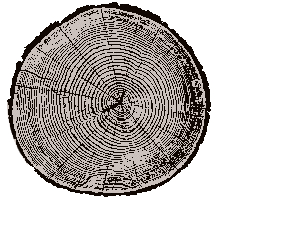
Dendrochronologists use tree rings to go back in time to learn more about past climate. Using straws to recreate tree rings, you can learn how dendrochronologists work. Construct a 50-year climatic history on a three- meter time line.

USGS
Materials
- One set of straws with tree-ring markings:

USGS
- One three-meter strip of adding machine tape for each group
- Colored pencils for each group
- Colored markers for each group
- A notebook for recording results (optional)
- Reference materials such as almanacs that provide students with dates of social and scientific events over the past four decades
Procedure
In groups of four, examine the set of straws that your teacher has prepared for you (by copying the Core Sample template onto the straws). Your samples have come from:
- Sample 1. A living tree, July 1992, Pinetown Forest.
- Sample 2. A tree from the Pinetown Christmas Tree Farm.
- Sample 3. A log found near the main trail in Pinetown Forest.
- Sample 4. A barn beam removed from Pinetown Hollow.
1. Determine the age of the tree by counting the rings. Record your information in a chart similar to the one found below:

USGS
-
Look for patterns in the tree rings. Once a ring pattern is discovered, line up all samples. Because you know that Sample 1 was cut in 1992, you can match the patterns of the other samples and determine when those trees were cut or cored and when they began to grow. Record this information in your chart.
-
Create a timeline. Spread out the adding machine tape. Beginning at the left end of the tape, record each year from the earliest year identified on the tree-ring samples through 1992. After the years are recorded on the strip, identify years that were good growing years for trees in Pinetown and years that were poor. Think of other events that might have happened during this time period, such as your birthday, presidential elections, important scientific discoveries, or record-setting sports achievements. Fill them in on the timeline. You can color the time line and illustrate it with drawings, photographs, or newspaper clippings.

USGS
Questions
- Which ring on each tree represents your birth year?
- What kind of growing season existed that year in Pinetown?
- In which years did droughts occur in Pinetown?
- Is there a pattern to the droughts?
- What buildings in your areas were built during the lifetime of these trees?
Extensions
Measure the tree rings in the photograph on the back of the poster. Assume the tree was cut in 1992. How old is the tree? Can you determine good and bad years for growth?
Find and map the locations of some of the oldest known trees in your neighborhood. Sketch what you think a core from one of these trees might look like.
Contact your local forestry service or science museum and obtain some actual cross sections of trees that have been cut in your area. Use the techniques applied during this activity to “read the tree.” If a tree has been cut in your neighborhood recently, look at the tree rings on the stump or ask if you can keep a small piece of the trunk.
Create some simulated core straws of your own for another group to analyze and report about.
For the Teacher
Aligning the Samples in the Lesson
The following illustration shows how samples 1 and 2 can be aligned. Have the students align all four samples so that the patterns match, and determine the years when each tree was cut and when it began to grow. Have them count all the rings from the oldest samples as they are aligned with the younger samples to determine the total amount of time represented by the rings. Count aligned rings that appear on several samples only once.
Charts
The charts should be completed as follows:

USGS
The total time covered by the tree rings is 50 years, from 1942 to 1992.
Answers to Questions
The answers to some of the questions in the activities will depend on the individual class-for example, when they were born or when buildings in their area were built. In looking at the climate record as revealed in the tree rings, notice that there is a significant period of poor growing conditions in each of the four decades covered by the tree samples. This pattern, which can be graphed, is the type of pattern scientists might look for when studying climate change.
Classroom Resources
Angier, Natalie, Warming?-Tree rings say not yet: New York Times, Tuesday,
December 1, 1992, p. C-1, C-4.
U.S. Geological Survey, 1991, Tree rings-timekeepers of the past: Reston,
Virginia, USGS, 15 p.
