Earth Science Week Classroom Activities
Mapping the Atmosphere
American Meteorological Society
Activity Source:
American Meteorological Society. Adapted with permission.
A map can represent data from an area on a flat surface. The part of our Earth system most frequently mapped is the atmosphere. Weather—the state of the atmosphere at a particular place and time—needs constant monitoring because it perpetually changes as weather systems evolve and move.
Awareness of what the weather is and is likely to be has numerous benefits. Weather can be hazardous, causing injuries, death, and loss of property. Weather maps are valuable analytical tools for informing people about current or future conditions.
In the United States, the National Oceanic and Atmospheric Administration’s National Weather Service (NWS) distributes observational data directly to the public and through private-sector partners. For example, NWS weather maps are available on the Internet.
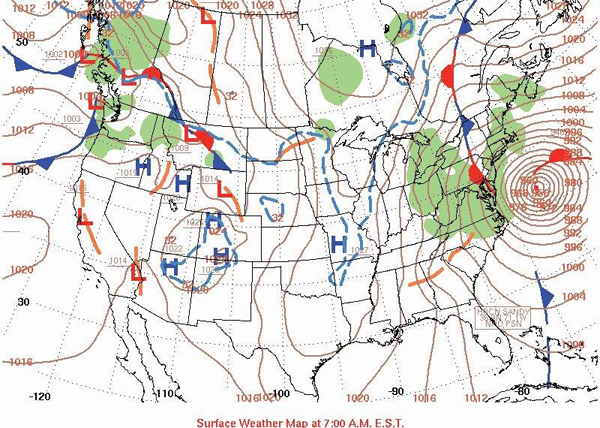
Revealing one of the most devastating weather disasters in U.S. history, the map used in this activity offers an analysis of surface weather conditions at 7 a.m. EST on October 29, 2012. The “bull’s eye” pattern of isobars (lines of constant pressure) depicts the low-pressure center of Superstorm Sandy, which rushed ashore in New Jersey and New York that evening.
Materials
- Computer with Internet access
Procedure
-
Go online to Daily Weather Maps at http://www.wpc.ncep.noaa.gov/dwm/dwm.shtml.
-
At left, select “October,” “29,” and “2012.” Click on “Get Map.” Is the large map that appears the same as the map shown below?
- Examine the large on-screen map. The brown curves on the map are isobars, labeled in millibars (mb) of pressure drawn at a 4-mb interval. Does the pattern of isobar values show that the center of Superstorm Sandy is low or high pressure?
- Click on the large on-screen map. The new map that appears displays observations made at individual weather stations. To decode the plotted data, click on “Go to station plot explanation” at the lower left of the large map. At the bottom of the page, click “Wind Speed and Direction” to interpret wind symbols on the map.
- Click “Back to Station Model” and then “Back to Previous Map” at the lower left of the screen until the large map appears. Then click on “Previous Day” until the daily map for Thursday, October 25, 2012, appears. (Date is printed in small font immediately below the map.) The first evidence of what would become Hurricane Sandy (and then Superstorm Sandy) appears over Cuba.
- Click “Next Day” successively several times to watch the movement and development of the storm system. What are some advantages to constantly monitoring the weather during the day?
There are numerous sources of weather maps extending from the surface of the Earth to the upper atmosphere. For simplified versions, see Datastreme Atmosphere. Access continuously updated weather maps that display surface observations and forecasts.