Earth Science Week Classroom Activities
Modeling Oil and Gas Reservoirs

Activity Source:
Adapted with permission by the American Association of
Petroleum
Geologists from AGI’s EarthComm, Earth’s Natural
Resources, pp. R65-R66.
This activity will help you to understand some of the factors that petroleum geologists need to consider when deciding where to recommend drilling for oil. Since people use petroleum products for energy and as source materials for petrochemicals, it is important as citizen scientists to understand the science and technology behind the search for oil and natural gas.
Materials
For a group of four:
- 500 mL clear plastic soda bottle with cap
- Supply of corn oil
- Water
- Protractor
- Notebook and pen
Procedure
-
Fill the soda bottle half full of water. Add corn oil until the bottle is three-quarters full. Cap the bottle. The water, oil, and air in the bottle represent water, crude oil, and natural gas. The bottle is a model of an oil and gas reservoir.
-
Slowly turn the bottle upside down so that no bubbles form. In your notebook, sketch a diagram to show the relationship between the oil, water, and air. Why do you think the materials stack in the order they do? If a well is drilled into an oil and gas reservoir, what material does it encounter first? Second? Third?
-
Tilt the bottle at a 45-degree angle and hold it there. Draw a diagram of the layers as viewed from the side of the bottle. Now, tilt the bottle at a 10-degree angle and draw the layers again. How does the surface area covered by the oil change with the angle of the oil reservoir?
-
Imagine drilling a vertical well through the tilted bottle. This represents a well drilled into reservoirs that are sloping at various angles in the subsurface. Would such a well penetrate a greater thickness of oil when the reservoir is at a 10-degree angle or when it is at a 45-degree angle? Why?
-
Look at the data table below, which shows the results of drilling four wells. The elevation at the top of each well was 5,000 feet above sea level.
| Feature | Well A | Well B | Well C | Well D |
|---|---|---|---|---|
| Elevation of top of VanSant Sandstone | 3650 ft. | 3850 ft. | 3950 ft. | 3900 ft. |
| Elevation of base of VanSant Sandstone | 3450 ft. | 3700 ft. | 3825 ft. | 3800 ft. |
| Result | Water (dry hole) | Oil at 3850 ft.; | ||
| Water at 3800 ft. | Gas at 3950 ft.; | |||
| Oil at 3875 ft. | Gas at 3900 ft.; | |||
| Oil at 3875 ft. |
The locations of the wells are shown on the map below. Symbols on the map show the results of drilling.
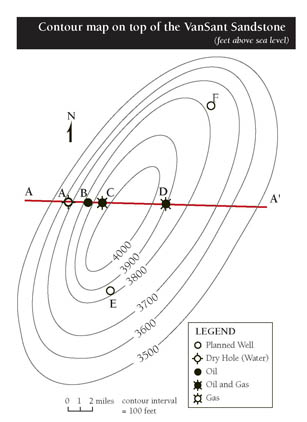
AAPG
- Draw a cross section across the oil field along the east-west line labeled A-A’. Plot the top and the base of the VanSant Sandstone. Use the results of the drilling to show the level of gas, oil, and water in the cross section.