Earth Science Week Classroom Activities
Reading Earth from the Air
Activity Source: American Geophysical Union
Grade levels: 8-12
Introduction
Scientists flying low over a landscape like the Appalachian Mountains (pictured here) use natural radioactivity to study the ground below. By measuring tiny amounts of energy released from rocks (gamma radiation), scientists can create maps that show what is underground. These maps help scientists locate resources, identify rock and mineral types, and even spot potential health risks like radon gas, all without having to disturb the environment. In this activity, students will explore real-world data collected by the U.S. Geological Survey to learn how to interpret color-coded radiometric maps made using gamma rays emitted from elements like potassium, uranium, and thorium.
Materials
-
Copy of or online access to the Eos article, New Maps of Natural Radioactivity Reveal Critical Minerals and More
-
Color copies or online access to:
- Satellite images and photos of the Appalachian Mountains (see step 3)
- Magnetic and Radiometric Survey Maps (see step 4)
-
Computer with internet access (and that allows downloads, if completing Extension 1)
Procedure
-
Consider what you know about radioactivity. Where have you heard about it? Can you describe what it is?
-
Read New Maps of Natural Radioactivity Reveal Critical Minerals and More and use it to answer the following questions:
- Summarize how radiometric surveys are conducted and what they measure.
- How does a radiometric survey compare to a magnetic survey?
- How is the data from these surveys used?
- What are three key radioelements can be detected by scientists using scintillation, and what mineral types can they indicate?
- Study Figure 1. Why do you think scientists chose to survey the areas on this map?
- Consider which areas were surveyed prior to the work being done by Earth MRI (starting in 2019). Why were these the first areas to be studied?
- Why do you think the Earth MRI program chose
- This article comes from an online publication called Eos. Choose two or three of the references listed at the end of the article (except the first one, which is also from Eos) and skim through them, including any figures and/or charts within them.
- Who do you think is the intended audience for each article?
- What do you notice about the language, length, and complexity of the references compared to the Eos article?
- What does this tell you about the purpose of Eos?
- Study satellite images and overhead photographs of the Appalachian Mountains.
- Consider the scale of each image: Which shows larger areas? Which are smaller, and how can you tell?
- Then, make observations of the images: What can you see? What patterns emerge? What processes, structures, or materials might be hidden, and what is preventing us from seeing them directly?
- Pennsylvania, ISS Photograph, Earth Science & Remote Sensing Unit, NASA, October 1993
- Virginia, near-nadir view, ISS Photograph, Earth Science & Remote Sensing Unit, NASA, March 1994
- Mid-Atlantic/Pennsylvania, Jeff Schmaltz, LANCE MODIS Rapid Response Team at NASA GSFC, NASA, November 2012
- Mid-Atlantic, ISS Crew Earth Observations, NASA Earth Observatory, January 2013
- Susquehanna River, Pennsylvania, ISS Photograph, Earth Science & Remote Sending Unit, NASA, December, 2019
- Mid-Atlantic, Moderate Resolution Imaging Spectroradiometer (MODIS), Terra Satellite, NASA, September 2023
- Southwest Virginia, Timelapse of Satellite Imagery, NASA Observatory, October to December 2025

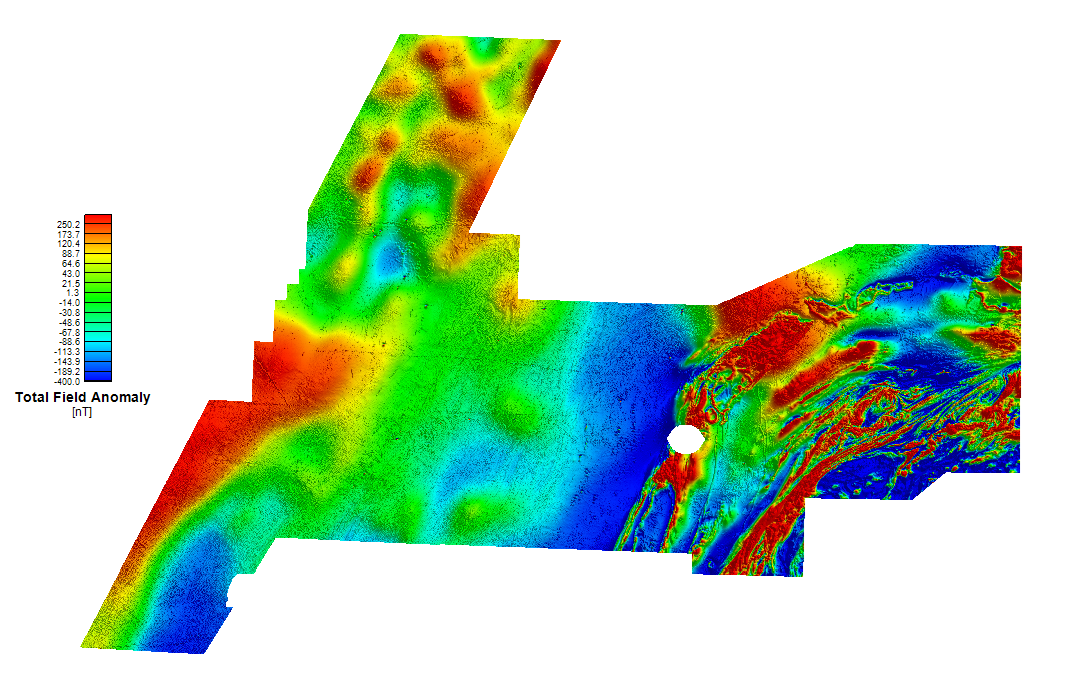
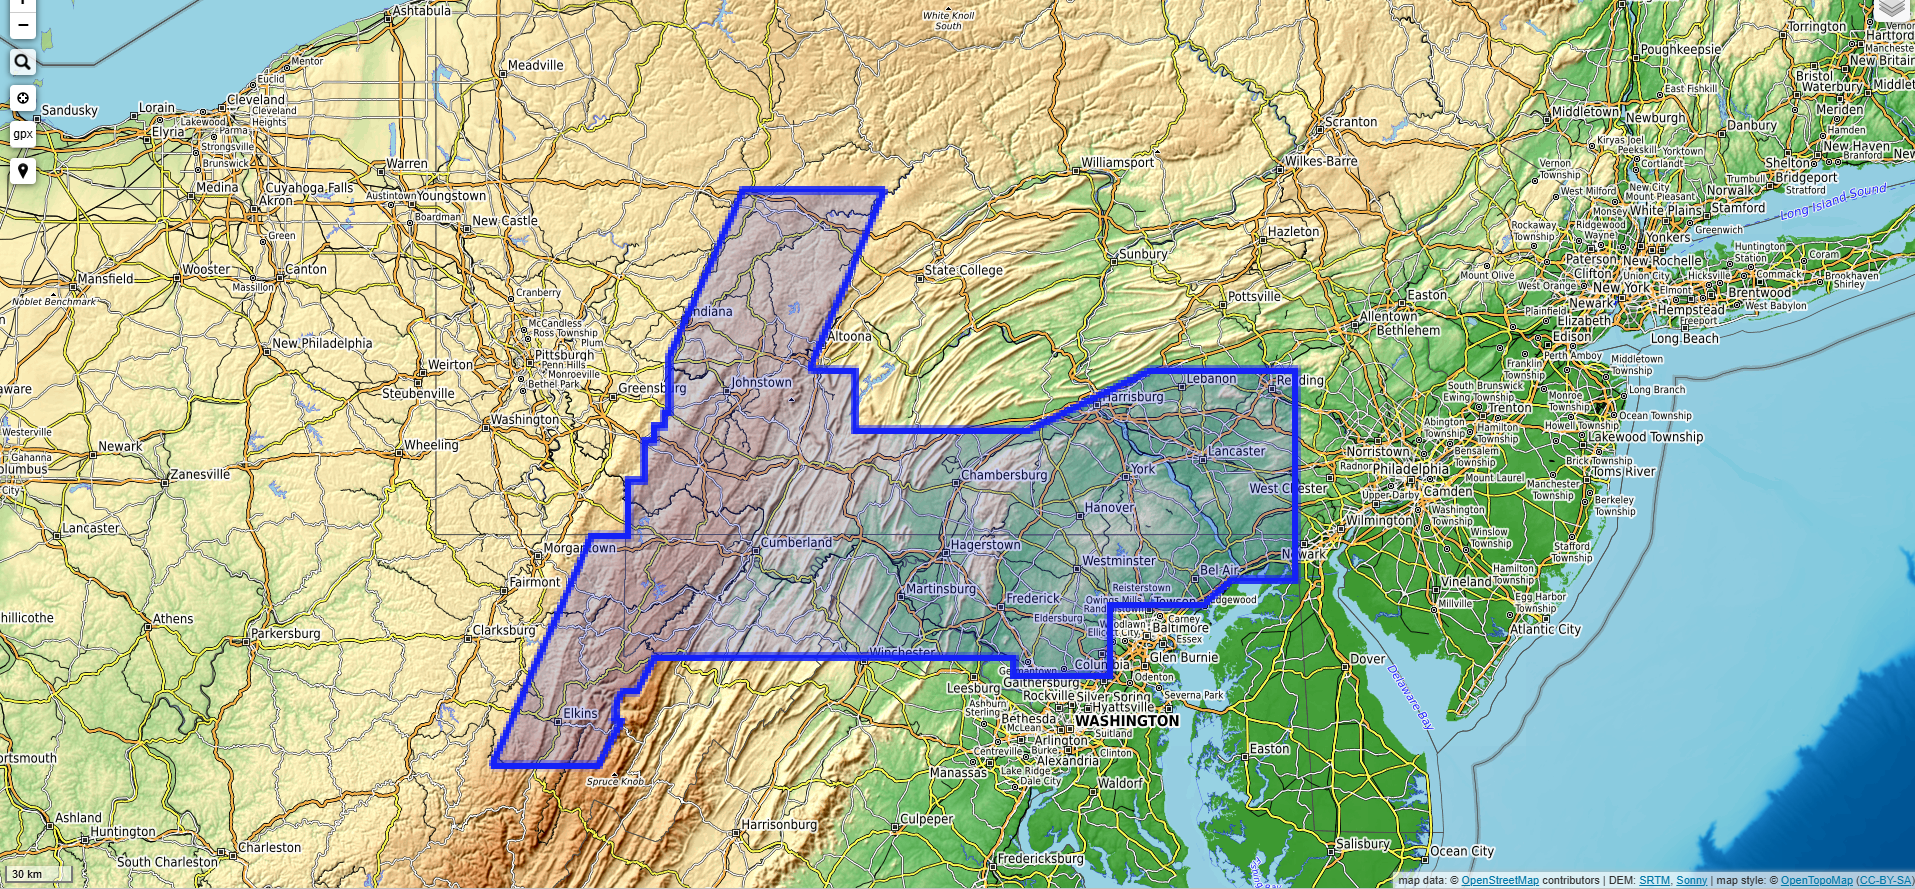
- Read about magnetic and radiometric survey data collected in the Mid-Atlantic region by the Maryland Geological Survey in 2022 and 2023. (View a map of where the data was collected here. Note that a circular region around Catoctin Mountain Park was not covered by these surveys.)
- As you study the data, consider how they are similar and different.
- View the magnetic survey data. The scale is shown as “Total Field Anomaly” meaning the colors represent the strength of the local magnetic field compared to the global average. Dark blues are the weakest magnetic fields compared to the global average. The strength of the local magnetic field increases as you go up through the colors. The global average for magnetic field strength falls within the upper green range.
- Then, view the radiometric survey data (automatic download). The scale is shown as “Total Count” meaning the total radioactivity (gamma rays) measured as the plane flew overhead. Dark blues show the lowest radioactive readings, which increases as you go up the color scale.
- Study a topographic map of the survey area (or use the Open Topo Map tool to zoom in on the area). How do the magnetic and radiometric data compare to the topographic map? Where do the datasets look similar to the map? What areas of the datasets stand out, and why?
- In the previous step, you made observations of raw datasets, however, scientists often interpret data to make sense of what it shows.
- In the case of radiometric survey data, scientists not only want to know the “Total Count” of gamma rays in the area, they want to know the specific elements that are emitting gamma radiation.
- Study the interpreted radiometric data map (automatic download). Revisit the reading in Step 1 as needed to review details about radiometric surveys.
- The key is represented as a ternary diagram (ternary means “three”):
- cyan = uranium
- magenta = potassium
- green = thorium
- Consider what the other colors (orange, yellow, and purple) mean, considering their location on the ternary diagram.
- Compare the interpreted data to the map that displays “Total Count” of radiation. How are they similar? How do they differ?
- The key is represented as a ternary diagram (ternary means “three”):
Analysis
- How do magnetic and radiometric surveys allow scientists to “see” where minerals might be located?
- What does the interpreted radiometric data reveal about the survey area?
- What element was detected most frequently? How can you tell?
- What elements were often detected together? How can you tell?
- What minerals might be present in this area based on the data? Research one of these minerals to learn about how it is used.
- What processes may have affected where specific elements/minerals are located in the area that was surveyed?
- Revisit the topographic map of the area to see what features are present.
- Learn about the formation of the Appalachian Mountains. Consider what processes contributed to mineral formation, then think about processes that might be occurring now that affect the distribution of those minerals.
Extension
- Revisit Figure 1 from New Maps of Natural Radioactivity Reveal Critical Minerals and More and identify another area to research that has had high-resolution radiometric surveys done by Earth MRI.
- Visit the Earth MRI website. Read about the program to learn about the work this initiative does.
- Click on “Explore our Data.” Study the left sidebar to learn about all the types of USGS reported on this interactive map.
- Uncheck all data types except “Magnetic-Radiometric.”
- Click within the area that you chose. Note that the left sidebar now shows what magnetic-radiometric projects have been or are currently being done in this area.
- Click “Data/Info,” then click the link next to “Download.”
- Look through the data under “Attached Files” to locate the radiometric data/ternary maps (some have previews, but many files have to be downloaded). Most data files will be images (.png or .tif), though some may be PDFs and/or in .zip folders.
- Make observations of the map. Does the ternary key use the same colors as the one for the Appalachian Mountains? Why might it be different? How does the data compare to that from the Appalachians?
- Revisit the interactive Earth MRI map and turn the other datasets back on to see what other studies are also occurring in the area you researched.
- Learn more about how scientists share what they discover with others via the American Geophysical Union (AGU), an organization that manages the online publication, Eos. This publication started as a print magazine over 100 years ago, and is now a digital news site, reaching more people than ever. Hundreds of articles are published on Eos each year that explain new research in ways students and the public can understand. It stories cover many topics including earthquakes, climate change, volcanoes, oceans, space, and natural resources like critical minerals.
Read the following Eos articles to learn more about real-world science and decision-making as it relates to critical minerals: Geological Surveys Unite to Improve Critical Mineral Security
- How does this article convey the urgency with which geologic surveys are trying to identify critical mineral deposits?
- How might partnerships between organizations and/or nations be beneficial in terms of sourcing critical minerals?
- How does this article relate to the “Reading the Earth from the Air” activity?
To Find Critical Minerals, Look to Plate Tectonics
- How does this article convey information about why critical minerals occur where they do?
- Who might use this information and how?
- How does this article relate to the:
- “Geological Surveys Unite to Improve Critical Mineral Security” article?
- “Reading the Earth from the Air” activity?
Next Generation Sceince Standards Connections
- SEP: Analyzing and Interpreting Data; Obtaining, Evaluating, and Communicating Information
- DCI: ESS2.A: Earth Materials and Systems; ESS3.A Natural Resources; PS1.C: Nuclear Processes
- CCC: Patterns; Scale, Proportion, and Quantity